Google Search Console Now Tracks AI Impressions (But There's a Huge Catch)
What Actually Shows Up in the New GSC Report
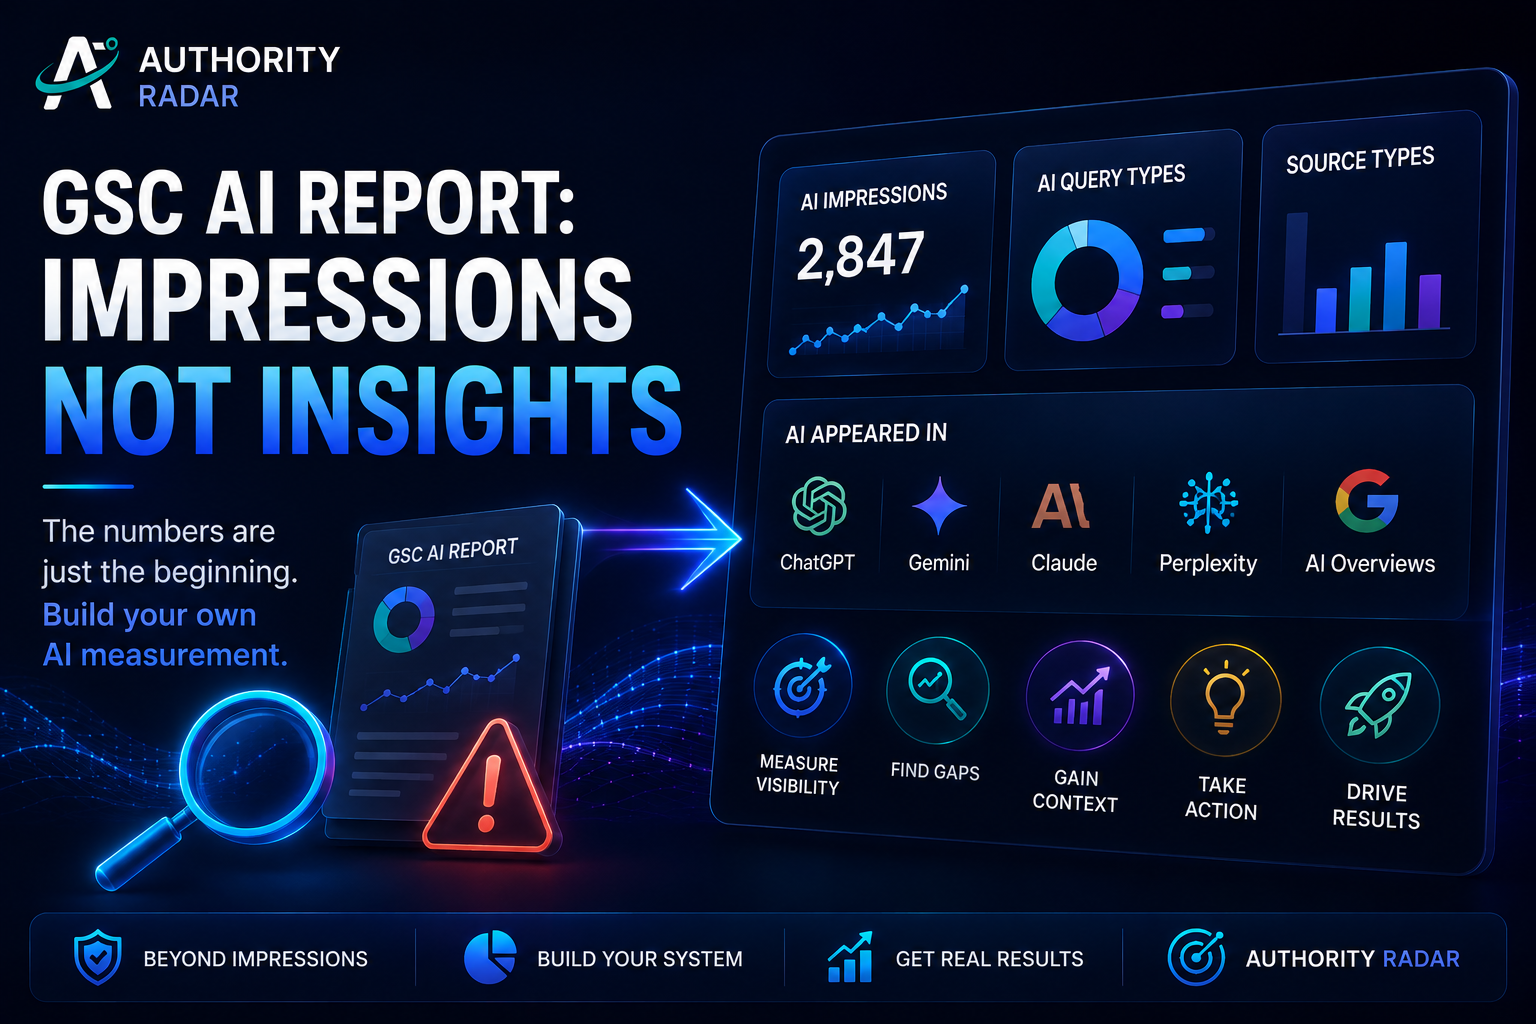
The "Search Generative AI Performance" report (or "AI Performance Report" in some GSC versions) is Google's first attempt at transparency for AI-driven search visibility. Here's what you actually see when you open it.
The Metrics You Get
Metric | What It Means | What's Missing |
|---|---|---|
AI Impressions | How many times your site appeared in AI Overviews, AI Mode, or Discover AI Overviews | Whether the user clicked, read, or cared |
AI Query Types | Categories of queries where you appeared (commercial, informational, etc.) | The exact queries, keywords, or user intent |
Source Types | Whether your site was cited as a web page, video, or forum post | Which specific page or content block was cited |
Trend Over Time | Impression count over days/weeks | No conversion data, no engagement data |
What the Report Looks Like in Practice
I pulled the report for a client site. It showed:
2,847 AI impressions in the last 28 days
65% from informational queries
30% from commercial queries
5% from local queries
Source: Web pages (80%), Videos (15%), Forums (5%)
That's it. I know they were seen 2,847 times. I don't know if anyone clicked. I don't know if anyone read the citation. I don't know if it drove a single conversion. I don't even know which specific pages were cited most often.
It's like a billboard company telling you "your ad was seen by 50,000 people" but not telling you if anyone visited your store afterward. It's technically true and practically useless for decision-making.
The Huge Catch: No Click Data, No Context, No Attribution
Google's official stance is that they are not providing click data because "AI interactions are complex and may not follow traditional click patterns." That's a polite way of saying: we don't want you to know how much traffic AI is actually driving, or we're not technically able to track it yet.
Why This Matters
Let's say the report shows 5,000 AI impressions for your ecommerce site. Here are three possible scenarios, all with the same impression count but wildly different business impact:
Scenario A: High-Intent Citations Your product was cited in 5 AI responses for "best [product] 2026" queries. Users saw your brand, clicked through, and bought. Those 5,000 impressions drove 500 clicks and 50 conversions. Your AI visibility is a goldmine.
Scenario B: Low-Intent Citations Your blog post was cited in 5 AI responses for informational queries. Users read the AI summary, got their answer, and never clicked. Those 5,000 impressions drove 50 clicks and 0 conversions. Your AI visibility is vanity metrics.
Scenario C: Negative Citations Your brand was mentioned in 5 AI responses, but in a negative context (e.g., "users report issues with [your brand]"). Those 5,000 impressions actually hurt your brand and drove 0 clicks. Your AI visibility is a liability.
The GSC report shows 5,000 impressions for all three scenarios. It cannot tell you which scenario you're in. That's the catch.
What Else Is Missing
Missing Data | Why You Need It |
|---|---|
Click-through rate (CTR) | To know if users are actually engaging with your citation |
Average position | To know if you're the #1 citation or the #5 citation |
Conversion data | To know if AI impressions drive revenue |
Query-level data | To know which specific questions your content answers |
Citation context | To know if the AI cited you positively, negatively, or neutrally |
Competitor comparison | To know if your competitors are getting more AI impressions |
Source page data | To know which of your pages are most cited |
AI model breakdown | To know if you're cited in Gemini, ChatGPT, Perplexity, etc. |
The GA4 Workaround: How to Estimate AI Traffic
Since GSC won't give you click data, you need to build your own measurement system. Here's a complete framework using GA4, self-reported attribution, and AI citation monitoring.
Layer 1: Self-Reported Attribution (The Foundation)
This is the most reliable method. Ask users directly how they found you.
Where to add it:
Demo request forms
Contact forms
Purchase checkouts
Newsletter signups
Post-purchase surveys
What to ask: "How did you hear about us?"
Google Search (traditional organic results)
Google AI / AI Overview
ChatGPT / OpenAI
Gemini / Google Bard
Perplexity
Claude / Anthropic
Social media
Referral from friend/colleague
Industry blog or publication
Podcast or video
Other (please specify)
How to calculate:
Total responses: 200
AI-driven responses: 45
AI attribution rate: 22.5%
If your total analytics traffic is 10,000 visitors, estimated AI traffic = 2,250 visitors
If your conversion rate is 2%, estimated AI conversions = 45
If your average order value is $500, estimated AI revenue = $22,500
Important: This is an estimate. It relies on user memory and honesty. Some users won't remember. Some will confuse "Google AI" with "Google Search." But it's the most accurate method available.
Layer 2: Brand Search Volume Tracking (The Proxy)
If AI awareness drives brand search, an increase in brand search volume is a proxy for AI visibility growth.
How to track in Google Search Console:
Go to Performance > Search Results.
Filter by your brand name and branded keywords (e.g., "[your brand] CRM", "[your brand] pricing").
Track impressions and clicks over time.
Look for spikes that correlate with AI citation events.
How to track in Google Trends:
Search for your brand name.
Set the timeframe to "Past 12 months" or "Past 90 days."
Look for spikes that don't correlate with marketing campaigns or PR events.
Spikes with no other explanation are likely AI-driven awareness.
Example: A SaaS client saw a 40% spike in brand search volume in March 2026. They had no marketing campaigns, no PR, no product launches. But they were heavily cited in AI responses for "best CRM for small teams." The AI awareness drove the brand search spike.
Layer 3: Direct Traffic Analysis (The Hidden Pipeline)
Direct traffic includes users who type your URL directly, use bookmarks, or click links that strip the referrer. AI-driven traffic often falls into direct because AI responses don't append referral parameters.
How to analyze:
In GA4, go to Acquisition > Traffic Acquisition.
Look at Direct traffic trends over time.
Compare Direct traffic to your historical baseline.
Look for landing pages that get direct traffic spikes.
What to look for:
A spike in Direct traffic to your product pages (not just your homepage). This suggests users saw your product in an AI response and typed the URL directly.
A spike in Direct traffic to your pricing page. This suggests users saw your pricing in an AI comparison and visited directly.
A spike in Direct traffic that correlates with AI citation monitoring data.
Example: An ecommerce brand saw a 25% spike in Direct traffic to their product detail pages in April 2026. Their brand search was flat. Their social traffic was flat. But they were cited in AI responses for product comparisons. The AI awareness drove direct visits to product pages.
Layer 4: AI Citation Monitoring (The Correlation)
Track your AI citations across platforms and correlate them with traffic and conversion changes.
What to track:
Weekly citation count across ChatGPT, Gemini, Perplexity, Claude, and Google AI Mode.
Citation sources (which of your pages are cited).
Citation context (positive, negative, neutral).
Citation position (are you the first recommendation or the fifth?).
Competitor citation comparison (are they cited more than you?).
Tools to use:
Authority Radar (or similar AI visibility monitoring tools) for automated tracking.
Manual searches for spot checks.
Browser snapshots for documentation.
How to correlate:
Week 1: Citation count = 15. Traffic = 10,000. Conversions = 50.
Week 2: Citation count = 30. Traffic = 12,000. Conversions = 65.
Week 3: Citation count = 45. Traffic = 14,500. Conversions = 80.
Correlation: Citation count up 200%, traffic up 45%, conversions up 60%.
This suggests a strong correlation between AI citations and business outcomes. Not perfect causation, but strong enough to justify investment.
Building a Complete AI Traffic Dashboard
Here's how to combine all four layers into a single dashboard that actually tells you something useful.
Dashboard Components
Metric | Source | Update Frequency | Purpose |
|---|---|---|---|
GSC AI Impressions | GSC AI Performance Report | Weekly | Volume of AI visibility |
Self-Reported AI Attribution | Forms and surveys | Monthly | Estimated AI traffic and conversions |
Brand Search Volume | GSC + Google Trends | Weekly | Proxy for AI awareness |
Direct Traffic Spike | GA4 | Weekly | Hidden AI pipeline |
AI Citation Count | Monitoring tool | Weekly | Correlation with traffic/conversions |
AI Citation Sentiment | Monitoring tool | Weekly | Is AI awareness positive or negative? |
Competitor AI Citations | Monitoring tool | Monthly | Are you winning or losing share? |
Estimated AI Revenue | Self-reported × AOV | Monthly | ROI of AI visibility |
How to Build It
Step 1: Set up a spreadsheet or BI dashboard. Use Google Sheets, Looker Studio, or a BI tool. Create a weekly data entry ritual.
Step 2: Automate what you can.
GSC AI impressions: Pull via API weekly.
Brand search volume: Pull via GSC API weekly.
Direct traffic: Pull via GA4 API weekly.
AI citations: Use a monitoring tool with API or export.
Step 3: Manual entry for self-reported data. Export form responses monthly. Categorize and calculate AI attribution rate.
Step 4: Calculate estimated AI revenue.
Total conversions × AI attribution rate = AI conversions.
AI conversions × average order value = AI revenue.
AI revenue ÷ AI optimization spend = AI ROI.
Step 5: Review monthly and adjust.
If AI revenue is growing: increase investment.
If AI revenue is flat but citations are up: fix conversion path.
If AI citations are declining: audit content and schema.
If sentiment is negative: fix source data and respond to misinformation.
The Niche Breakdown: How This Affects Different Industries
Ecommerce: The Inventory Visibility Problem
Ecommerce brands live and die by inventory visibility. If the AI says you're in stock and you're not, you lose trust. If the AI says you're out of stock and you're not, you lose sales.
What the GSC report won't tell you:
Whether your product citations included accurate pricing.
Whether your citations included accurate availability.
Whether users clicked "Buy" after seeing the AI citation.
Whether your competitor's AI citations showed better pricing.
What you need to do:
Maintain real-time inventory feeds in Google Merchant Center.
Use product schema with availability and pricing on every page.
Monitor AI citations for product queries daily.
Set up self-reported attribution on purchase checkout.
Track brand search volume for product-specific queries.
Example: A fashion retailer saw 3,000 AI impressions for "best summer dresses 2026" but no corresponding sales spike. They investigated and found the AI was citing their blog post about summer trends, not their product pages. The citations drove awareness but not conversions. They added product schema to their trend blog posts and saw a 15% conversion lift.
SaaS: The Demo Request Pipeline
SaaS brands rely on demo requests and free trials. AI citations for "best [category] for [use case]" can drive high-intent leads. But if you can't measure it, you can't optimize it.
What the GSC report won't tell you:
Whether AI citations drove demo requests.
Whether the AI cited your pricing accurately (a $10/user/month error can kill conversions).
Whether the AI compared you to the right competitors.
Whether users who saw AI citations converted at higher or lower rates than organic visitors.
What you need to do:
Add "How did you hear about us?" to your demo request form.
Track brand search volume for category + use case queries.
Monitor AI citations for your top 10 target keywords weekly.
Build comparison pages with structured data so the AI cites accurate information.
Use Authority Radar to track citation accuracy and competitor comparison.
Example: A project management SaaS brand saw 500 AI impressions in GSC but only 10 demo requests from "organic search" that month. They added self-reported attribution and found 35% of demo requests came from AI (ChatGPT and Gemini). The AI traffic was invisible. They shifted 20% of their SEO budget to AI optimization and saw a 40% demo request increase in 60 days.
Local Business: The "Near Me" Gap
Local businesses rely on "near me" queries. AI Overviews for local queries now include maps, business cards, and review summaries. But the GSC report won't tell you if users called or visited after seeing the AI citation.
What the GSC report won't tell you:
Whether users called after seeing your AI citation.
Whether users visited after seeing your AI citation.
Whether the AI showed your correct hours, phone number, and address.
Whether your competitor's AI citation had better reviews or more photos.
What you need to do:
Complete your Google Business Profile with photos, hours, and services.
Add LocalBusiness schema with all properties.
Use call tracking numbers to measure AI-driven calls.
Track brand search volume for "[your business] near me" queries.
Monitor AI citations for local queries and correct misinformation.
Example: A dental practice saw 800 AI impressions in GSC but no increase in appointment bookings. They checked the AI citations and found the AI was showing their old address from a 2024 directory listing. They updated their Google Business Profile and local schema, and appointment bookings increased 20% in 2 weeks.
Media and Publishing: The Ad Revenue Threat
Media sites face the most existential threat from AI summaries. If the AI summarizes your article, users don't click. Your ad impressions drop. Your revenue drops. The GSC report shows impressions but not the revenue loss.
What the GSC report won't tell you:
How many users read the AI summary instead of clicking your article.
How many ad impressions you lost to AI summaries.
Whether users who did click had higher or lower engagement than pre-AI visitors.
Whether opting out of AI Overviews would restore your traffic (and revenue).
What you need to do:
Test the GSC opt-out toggle (see Article 3) and measure revenue impact.
Add self-reported attribution to newsletter signups (free users who convert to paid).
Track brand search volume for your publication name.
Build video and interactive content that AI cannot fully summarize.
Create original research that drives clicks even when summarized.
Example: A tech news site saw 10,000 AI impressions in GSC but a 15% drop in ad revenue. They tested the opt-out toggle for 30 days. Ad revenue recovered 12%, but brand search dropped 8%. They decided to stay opted in but added a subscription paywall and a "Read the full analysis" call to action in their meta descriptions. Revenue stabilized.
What Google Should Add to the GSC Report (But Probably Won't)
Here's what would make the GSC AI Performance Report actually useful:
Click data: Even if it's directional. "Estimated clicks from AI citations" would be better than nothing.
Query-level data: Which specific queries triggered AI citations? This is the most actionable data for content optimization.
Citation context: Was the citation positive, negative, or neutral? Did the AI recommend us or just mention us?
Competitor comparison: How many AI impressions did our competitors get for the same queries?
Conversion tracking: Integration with GA4 to show AI-driven conversions, even if it's modeled.
AI model breakdown: Which AI models (Gemini, ChatGPT, Perplexity) are citing us? Each model has different citation patterns.
Source page data: Which of our pages are most cited? This tells us what content to create more of.
Google has the data. They just haven't given it to us. Until they do, we need to build our own measurement systems.
Key Takeaway
The GSC AI Performance Report is a start, but it's a thin start. It tells you that AI is seeing you, but not whether AI is helping you. The huge catch is that impressions without clicks, context, or attribution are just vanity metrics.
The brands that win in 2026 will not be the ones that look at the GSC report and say "great, 5,000 impressions." They will be the ones that build a complete measurement system — self-reported attribution, brand search tracking, direct traffic analysis, and citation monitoring — to understand what those impressions actually mean for their business.
Google gave us a billboard. We need to build the store counter.
Last Updated: June 2026; This guide was updated following the June 2026 GSC AI Performance Report rollout and includes a complete GA4 workaround framework and niche-specific measurement strategies.